Technology in Social Studies: Comparing History and Geography
Introduction:
These two activities will use a combination of primary sources, surveys/interviews, statistical analysis, and working with maps / Google Earth in order to draw conclusions and make predictions about transportation trends at home and abroad.
These two activities will use a combination of primary sources, surveys/interviews, statistical analysis, and working with maps / Google Earth in order to draw conclusions and make predictions about transportation trends at home and abroad.
I. Relative Advantage
In 1994 the NCSS (National Council for the Social Studies) released a set of recommended national social studies standards based around themes. These standards focus on the "end goal" of social studies: to understand how history, geography, sociology, relationships, and systems forge where we are today and how we can create a better tomorrow.
By conducting interviews, examining primary historical sources, analyzing statistics, and creating visual and geographical representations, students will have a chance to engage in authentic and purposeful social studies beyond rote memorization or merely acquiring facts. Using primary sources will allow students to see historical events from specific perspectives and to compare and interpret the events through those subjective human lenses. Likewise, analyzing statistics and geographical data will teach students how to identify whether or not patterns exist, what variables may cause trends to occur, and thus students have the problem-solving tools to predict and proactively engage in creating their future environments. These skills are related to the following NCSS themes:
II. Objectives and Assessments
III. Integration Strategies
This project actually consists of two separate but related activities. Both activities acknowledge the subjective nature of historical perspective and how to use critical analysis techniques to derive conclusions or an overall perspective. The first activity requires students to investigate primary sources throughout history to determine uses and perceptions of transportation; the second activity requires gathering additional primary-source perspectives through interviewing friends, family, and relatives Estimated time: 2 weeks.
Day 1: Introduce the first step of the second activity to allow students time to complete the task for homework: students must survey/interview 3 people (friends, family, or strangers) of different generations. For the purpose of this exercise, "generations" will be as follows: 18-40 years old; 40-60 years old; 60-80 years old; over 80 years old.
Students will need to determine what they will need to ask in the interview/survey in order to determine whether popular modes of transportation have changed over time. Students should consider all of the different variables that could affect choices of transportation, including: geographic location; community type (rural, urban, suburban); socio-economic status; employment/occupation. Also, have perceptions or uses of transportation changed? Each respondent should give data for when they were a kid (under 18 years old) versus their present-day situation and feelings.
Students should be given until the beginning of the following week to conduct these interviews. Meanwhile, introduce first activity: students will choose or be assigned a mode of transportation to investigate through historical primary sources. Students may access many of these resources through use of the Primary Sources link on this website.
Days 2-3: Students will investigate the primary sources and take notes using MyWebspiration to organize the following into a concept map: author; tone; date; location; point of view; pros and cons for the transportation mode represented in the primary source.
Days 4-5: Based on these multiple perspectives, students will write a persuasive argument for whether the transportation has done more good than harm or more harm than good. Students will do a paired proofreading and revision before submitting finished work to Edmodo.
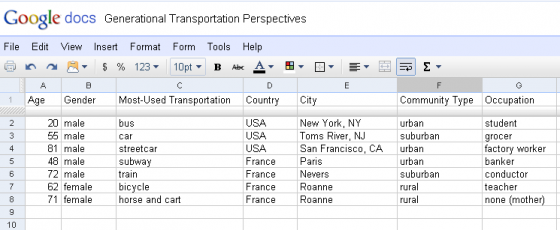
Day 6: Students create and set up spreadsheets to record each of the variables they recorded in their interviews. Two sheets should be made: one to represent transportation choices when young and one to represent current transportation preferences.
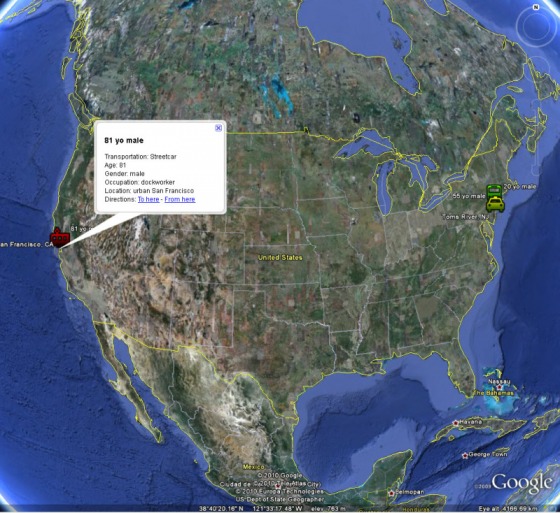
Day 7: Students will mark locations in Google Maps to represent where these respondents lived at the time they used the specified mode of transportation. Students will use color coded symbols to show gender and generation (green = 20-40, yellow = 40-60, blue = 60-80, red = 80+), and will add additional information including occupation, gender, etc. with a note box.
In 1994 the NCSS (National Council for the Social Studies) released a set of recommended national social studies standards based around themes. These standards focus on the "end goal" of social studies: to understand how history, geography, sociology, relationships, and systems forge where we are today and how we can create a better tomorrow.
By conducting interviews, examining primary historical sources, analyzing statistics, and creating visual and geographical representations, students will have a chance to engage in authentic and purposeful social studies beyond rote memorization or merely acquiring facts. Using primary sources will allow students to see historical events from specific perspectives and to compare and interpret the events through those subjective human lenses. Likewise, analyzing statistics and geographical data will teach students how to identify whether or not patterns exist, what variables may cause trends to occur, and thus students have the problem-solving tools to predict and proactively engage in creating their future environments. These skills are related to the following NCSS themes:
- Theme 1: Culture
- Theme 2: Time, continuity, and change
- Theme 3: People, places, and environments
- Theme 7: Production, distribution, and consumption
- Theme 8: Science, technology, and society
- Theme 9: Global connections
II. Objectives and Assessments
- Outcome: Persuasive writing. Objective: Students will choose one mode of transportation from history and will write a persuasive essay explaining whether the development was mostly good for humanity or did more harm than good to the world. Assessment: Persuasive writing rubric.
- Outcome: Interview/survey, spreadsheet, and scatter plot charts. Objective: Students will interview/survey respondents of various ages to determine current and historical transportation preferences and uses. Assessments: (1) Individual data for three different generational groups added to class collaborative spreadsheet. (2) Conclusion statement with supporting details based on class scatter plot charts.
- Outcome: Cross-generational transportation perspectives map. Objective: Students will mark geographic world locations of interviewees in Google Earth. Assessment: Google Earth with color-coded place markers for each interview respondent.
III. Integration Strategies
This project actually consists of two separate but related activities. Both activities acknowledge the subjective nature of historical perspective and how to use critical analysis techniques to derive conclusions or an overall perspective. The first activity requires students to investigate primary sources throughout history to determine uses and perceptions of transportation; the second activity requires gathering additional primary-source perspectives through interviewing friends, family, and relatives Estimated time: 2 weeks.
Day 1: Introduce the first step of the second activity to allow students time to complete the task for homework: students must survey/interview 3 people (friends, family, or strangers) of different generations. For the purpose of this exercise, "generations" will be as follows: 18-40 years old; 40-60 years old; 60-80 years old; over 80 years old.
Students will need to determine what they will need to ask in the interview/survey in order to determine whether popular modes of transportation have changed over time. Students should consider all of the different variables that could affect choices of transportation, including: geographic location; community type (rural, urban, suburban); socio-economic status; employment/occupation. Also, have perceptions or uses of transportation changed? Each respondent should give data for when they were a kid (under 18 years old) versus their present-day situation and feelings.
Students should be given until the beginning of the following week to conduct these interviews. Meanwhile, introduce first activity: students will choose or be assigned a mode of transportation to investigate through historical primary sources. Students may access many of these resources through use of the Primary Sources link on this website.
Days 2-3: Students will investigate the primary sources and take notes using MyWebspiration to organize the following into a concept map: author; tone; date; location; point of view; pros and cons for the transportation mode represented in the primary source.
Days 4-5: Based on these multiple perspectives, students will write a persuasive argument for whether the transportation has done more good than harm or more harm than good. Students will do a paired proofreading and revision before submitting finished work to Edmodo.
Day 6: Students create and set up spreadsheets to record each of the variables they recorded in their interviews. Two sheets should be made: one to represent transportation choices when young and one to represent current transportation preferences.
Day 7: Students will mark locations in Google Maps to represent where these respondents lived at the time they used the specified mode of transportation. Students will use color coded symbols to show gender and generation (green = 20-40, yellow = 40-60, blue = 60-80, red = 80+), and will add additional information including occupation, gender, etc. with a note box.
Day 8: Students will swap and compare data with their international ePals, adding the ePal's gathered info to their spreadsheets and maps.
Days 9: Students submit their individual spreadsheets and maps via Edmodo. Today, the class will merge their spreadsheets and maps into a collective whole. The teacher will demonstrate how to create bar graphs comparing age, gender, and most popular modes of transportation from youth. Are preferred modes of transportation equally distributed across genders and generations? Are they randomly or equally distributed, or does there appear to be trends? Do these trends hold the same for all geographic locations?
Day 10: Students write a conclusion about whether transportation uses have changed over the past 80 years and, if so, what are the trends? If no trends seem to be present, why not? Are other variables at play other than time/age?
IV. Instructional Environment
- Computers with Internet connection and Google Earth installed: earth.google.com
- Edmodo site for primary sources and work submissions: edmodo.com
- Google Spreadsheets: docs.google.com
- ePals: ePals.com
- Concept Web / Mind Mapping: mywebspiration.com
